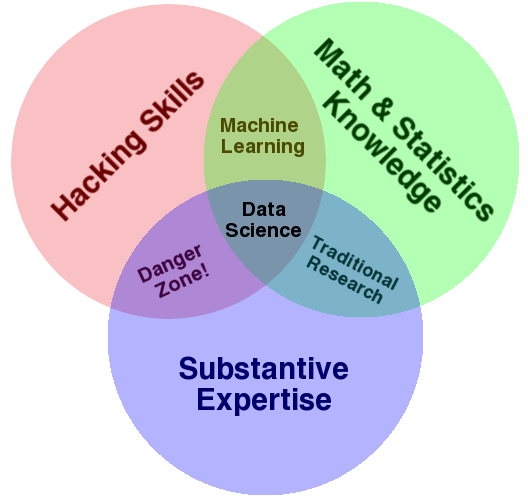
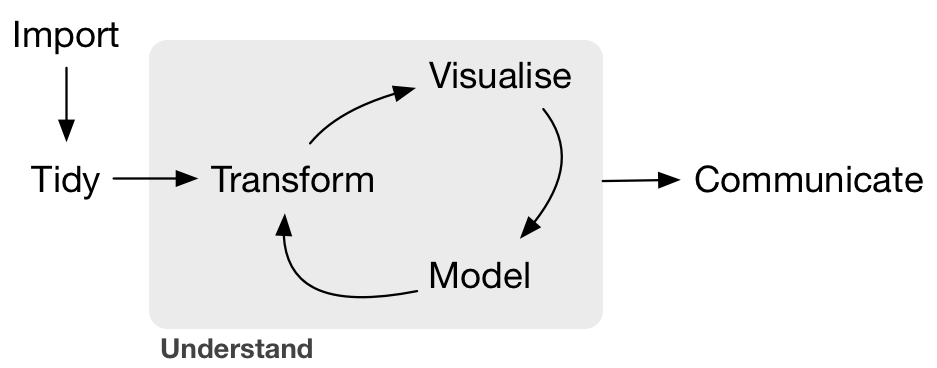
class: center, middle, inverse, title-slide # Intro to R Working Session ## EPSY 887 - Fall 2019 ### Jason Bryer, Ph.D. ### University at Albany ### 2019-09-05 --- # Data Science Skills  Conway (2010). http://drewconway.com/zia/2013/3/26/the-data-science-venn-diagram --- # Data Science Workflow  Wickham & Grolemund (2008) --- # Setup RStudio Project 1. Click "File" -> "New Project" 2. Choose "Existing Directory" or "New "Directory", as appropriate. 3. Create a subdirectory called "data". 4. Download these R scripts into the root directory (right click and choose "Save Link As...") https://raw.githubusercontent.com/jbryer/EPSY887-Fall2019/master/R/mass_analysis.R https://raw.githubusercontent.com/jbryer/EPSY887-Fall2019/master/R/Setup.R 5. Download the data file into the data directory https://github.com/jbryer/EPSY887-Fall2019/raw/master/datasets/MathAnxiety.xlsx 6. Open the `mass_analysis.R` file --- # Functions These are the functions<sup>1</sup> we will use today: .pull-left[ * apply * c * complete.cases * describe * describeBy * factor * head * likert * mean * median * names ] .pull-right[ * ncol * nrow * plot * rbind * read_xlsx * sd * str * summary * table * tail ] .footnote[<sup>1</sup> To get help on a function, type `?function` in the R console.]